Your Budget.Your Story.
Built for people who actually track money
11 powerful tools — from daily spending to debt tracking — all in one app. Free, private, and built to last.
All 11 Features
One app. Every tool you need.
Dashboard
Your financial command center
See your monthly income, expenses, savings rate, and today's spend at a glance. Recent transactions, smart insights, and a monthly report — all in one place.
- Monthly income & expense totals
- Savings rate badge
- Today's spend tracker
- Recent 5 transactions with edit/delete
Transactions
Every rupee, accounted for
Full transaction history with search, filter by month, edit in place, and delete with confirmation. Color-coded categories make scanning fast.
- Search & filter by month
- Edit any transaction inline
- Category icons & colors
- Sorted newest-first
Calendar View
See your spending in time
Heat-map calendar shows heavy vs light spending days at a glance. Navigate months, view per-day breakdowns, and click any transaction to open its detail.
- 4-tier heat map coloring
- Month stats bar (income/expense/net)
- Income dot per day
- Click-through to transaction detail
Budget Goals
Spend with intent
Set monthly spending limits per category. Speedometer gauges show utilization in real time — green when on track, orange at 80%, red when over.
- Per-category limits
- Speedometer utilization gauge
- Over-budget & warning badges
- Remaining amount calculation
Recurring Transactions
Never miss a subscription
Track subscriptions, rent, salary, and any repeating payment. Log instantly, pause without deleting, and see your total monthly recurring outflow.
- Daily / weekly / monthly frequency
- Log Now — posts instantly
- Pause & resume without deleting
- Monthly outflow summary
Debt & Lent
Know who owes what
Track money you've lent to friends and money you owe. Set due dates, mark as cleared, and see overdue alerts. Pending and cleared entries kept separate.
- Lent vs debt split view
- Due date & overdue badge
- Mark as cleared
- Total owed / owed-to summary
Net Worth
Your financial snapshot
Track your bank balance and total net worth. Update your balance inline with a single tap — no separate page or form needed.
- Bank balance tracking
- Inline edit with Enter/Escape
- Total net worth calculation
- Assets section (coming soon)
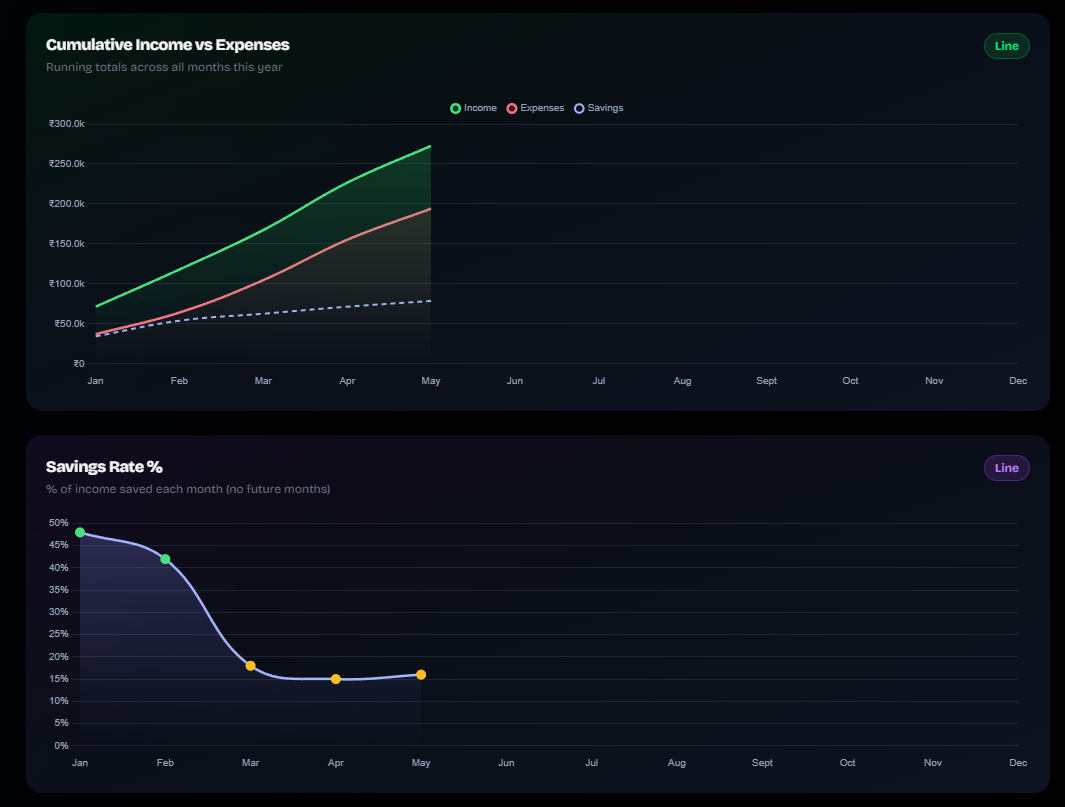
Charts & Analytics
Visualize your money
Five powerful chart views that turn raw numbers into clear financial stories. Understand patterns, spot trends, and see exactly where your money goes.
- Category breakdown pie chart
- Monthly income vs expense bars
- Spending trend line over time
- Weekly rhythm sparklines
- Calendar heatmap (daily intensity)
Expense Tracker
Your outflows, filtered
A dedicated view of only your expenses — searchable, filterable by month, with a running total for the selected period.
- Expense-only view
- Monthly total at a glance
- Edit & delete inline
- Empty state with quick-add CTA
Income Tracker
Your inflows, at a glance
A clean view of all income transactions. Know exactly what came in and when, with category and payment mode at a glance.
- Income-only view
- Monthly inflow total
- Category & payment mode tags
- Sortable by date
Profile & Data
Own your data
Export all your transactions as JSON, import from a backup, change your password, or wipe everything. Full control, no lock-in.
- Export transactions to JSON
- Import from backup file
- Change password securely
- Delete all data (with confirmation)
Charts & Analytics
Five views. Total financial clarity.
Numbers alone don't tell the story. These charts turn your raw transaction data into patterns you can actually act on.
Category Breakdown
Pie chart showing which spending categories eat up the most budget each month.
Income vs Expenses
Grouped monthly bars — instantly compare what came in vs what went out.
Spending Trend Line
Rolling line chart that reveals if your spending is climbing or falling over time.
Weekly Rhythm Sparklines
Day-of-week sparklines expose habitual spending patterns — weekends, paydays, and more.
Calendar Heatmap
Full-month grid where color intensity shows heavy vs light spending days at a glance.
Categories
10 spending categories
Every transaction is tagged, color-coded, and icon-labeled.
Our Promise
Why MyBudgetory?
No ads. No upsells. No nonsense.
No fluff
Every feature solves a real budgeting problem. No filler.
JWT secured
Auth-protected routes, encrypted tokens, no data leaks.
Your data
Export everything as JSON anytime. No lock-in, ever.
Private
Your transactions are never shared or sold. Period.
Ready to take control?
Free. Always. No credit card.